Trading Update: Thursday April 24, 2023
S&P Emini pre-open market analysis
Emini daily chart
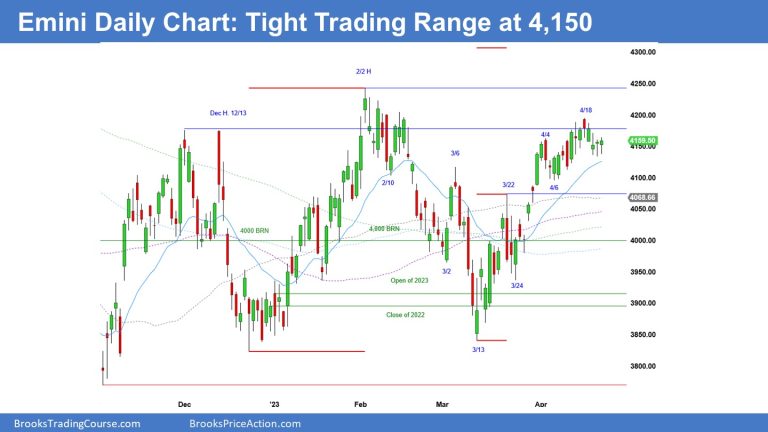
- The Emini sold off, testing last Friday’s low, and rallied above the open, creating a bull reversal bar. Bulls upside breakout wanted above April 18th high.
- Emini 抛售,测试上周五的低点,并在开盘价上方反弹,形成牛市反转柱。多头希望突破 4 月 18 日的高点。
- At the moment, the odds slightly favor the upside breakout and test of the February 2nd high; however, if the probability truly favored the bulls, we would not be going sideways here.
- 目前,上行突破和测试 2 月 2 日高点的可能性略大;然而,如果概率真的有利于多头,我们就不会在这里横盘整理。
- The market continues to find support near the moving average (blue line) and 4,150.
- 市场继续在移动平均线(蓝线)和 4,150 附近找到支撑。
- There are two important targets above and below. They are the 4,000 big round number and 4,300, the measured move projection from the March 13th low to the March 22nd high.
- 上面和下面有两个重要的目标。它们是 4,000 大整数和 4,300,即从 3 月 13 日低点到 3 月 22 日高点的测量移动预测。
- It is common for the market to go sideways in the middle of an important support and resistance level. Looking at the chart, 4,150 is right in between the two important magnets mentioned above, which increases the odds more sideways trading around 4,150.
- 市场在重要的支撑位和阻力位中间横盘整理是很常见的。从图表上看,4,150 恰好位于上述两个重要磁铁之间,这增加了在 4,150 附近横向交易的可能性。
- Since the market has been sideways for more than 12 bars, it is in breakout mode, which means the probability is close to 50% for a breakout up or down.
- 由于市场横盘超过 12 根柱线,它处于突破模式,这意味着向上或向下突破的可能性接近 50%。
- Also, the market has been above the moving average for 18 bars, another sign of strength by the bulls.
- 此外,市场已经超过移动平均线 18 根柱线,这是多头力量的另一个迹象。
- Overall, most traders should wait for a breakout up or down. If the bulls or bears start to get consecutive strong trend bars, the probability will increase for a successful breakout.
- 总的来说,大多数交易者应该等待向上或向下的突破。如果多头或空头开始出现连续的强趋势条,成功突破的可能性就会增加。
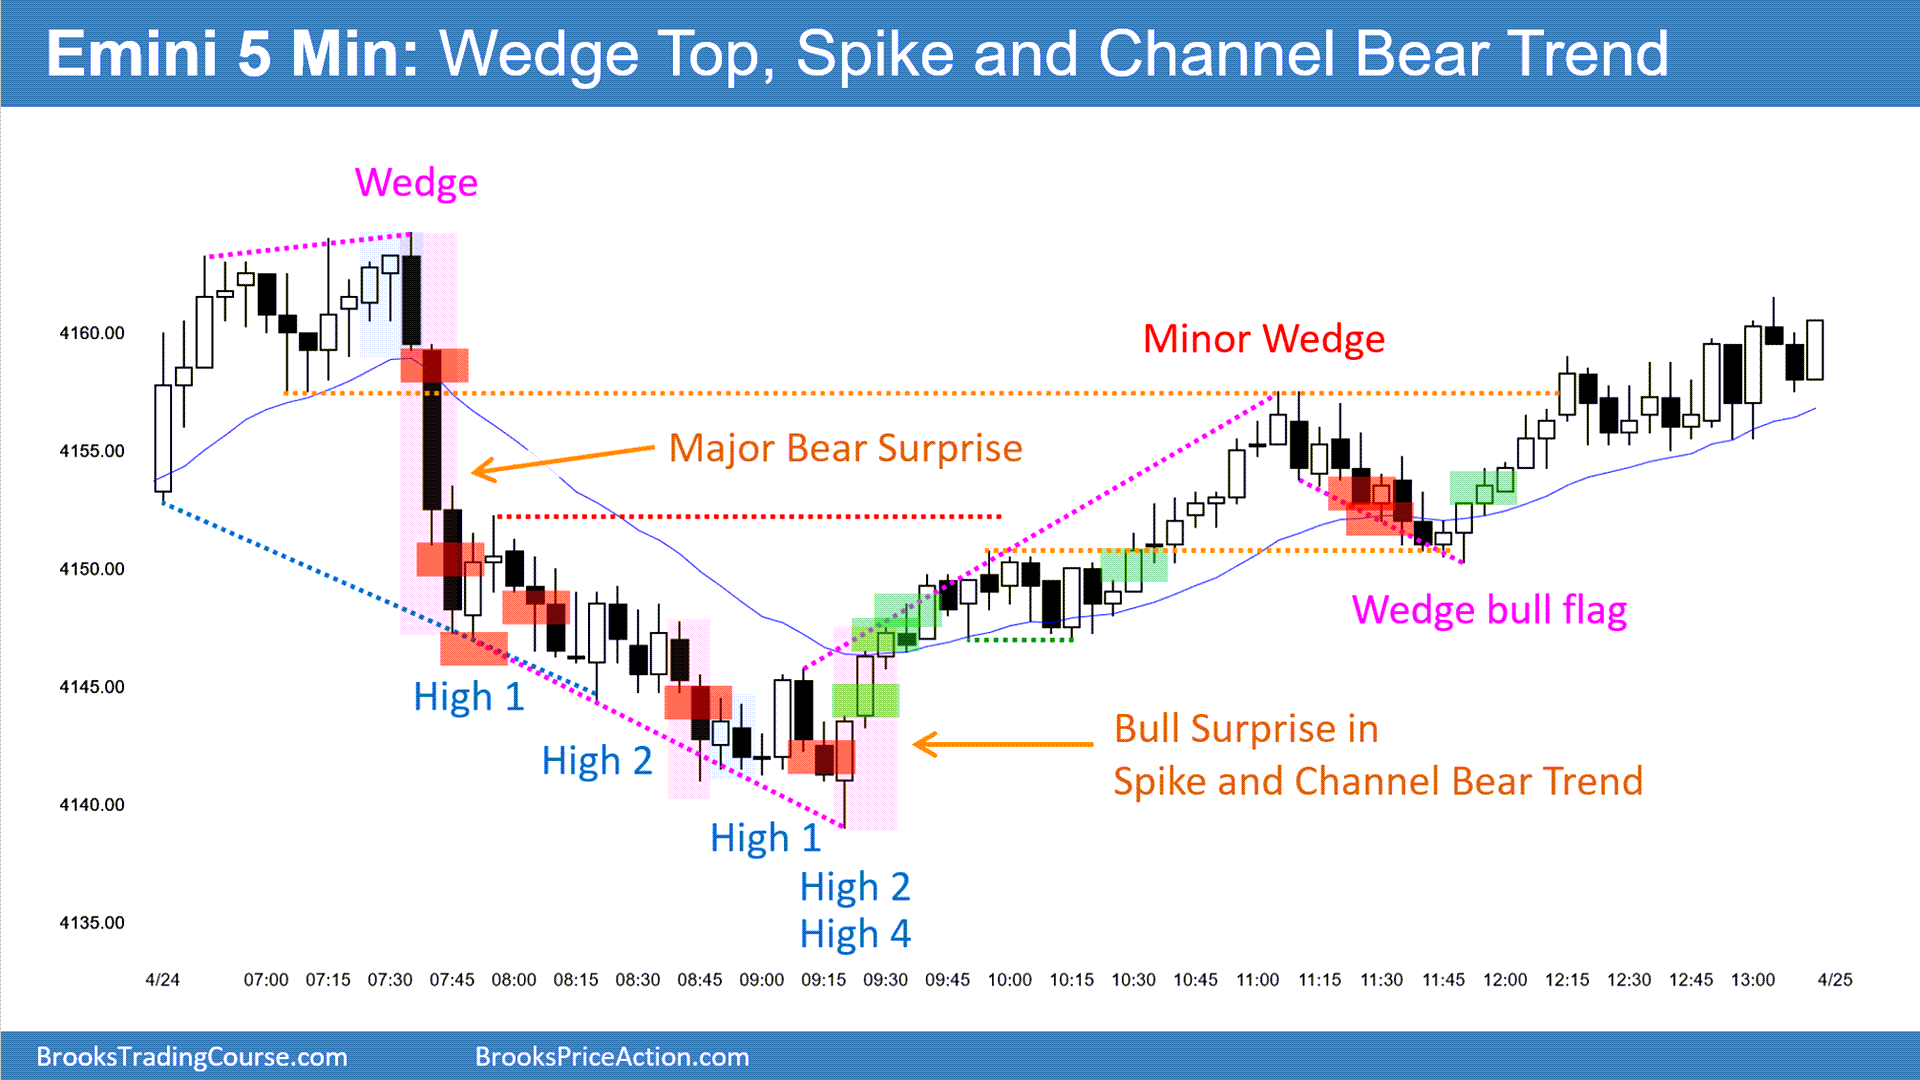
Emini 5-minute chart and what to expect today
- Emini is down 18 points in the overnight Globex session.
- The overnight Globex session sold off but failed to break below the April 24th low.
- 隔夜 Globex 交易时段出现抛售,但未能跌破 4 月 24 日的低点。
- The bulls see the early selloff below the April 24th low as a 2nd leg trap following yesterday’s late selloff after the U.S. Session closed.
- 多头将 4 月 24 日低点下方的早盘抛售视为继昨天美国时段收盘后的尾盘抛售之后的第二条腿陷阱。
- On the 60-minute chart, the Globex market is in a broad bear channel for several bars with lots of decent buying pressure. This increases the odds of an upside breakout soon and a test of the most recent lower high (April 24th high).
- 在 60 分钟图上,Globex 市场处于宽阔的熊市通道中,有几个柱线,买盘压力很大。这增加了很快向上突破和测试最近较低高点(4 月 24 日高点)的可能性。
- Since the Globex market on the 60-minute chart is trying to form a wedge bottom, this will increase the odds of a possible rally on the open today.
- 由于 60 分钟图表上的 Globex 市场正试图形成楔形底部,这将增加今天开盘可能反弹的可能性。
- As I often say, traders should assume that the open will have a lot of trading range trading. Most traders should wait for 6-12 bars before placing a trader unless they are quick to make decisions and can trade with limited orders.
- 正如我经常说的,交易者应该假设开盘会有很多交易区间交易。大多数交易者在下单之前应该等待 6-12 根柱线,除非他们能够快速做出决定并且可以使用有限的订单进行交易。
- There is more than an 80% chance of a swing trader on the open, beginning before the end of the second hour. The swing trade typically starts after the formation of a double top/bottom or a wedge top/bottom.
- 在第二个小时结束之前开始,波段交易者有超过 80% 的机会开盘。波段交易通常在双顶/双底或楔形顶/底形成后开始。
- The most essential thing on the open is to be patient. There are 81 bars on a 5-minute chart, and by waiting for 6 bars, a trader will gain more clarity on the likely structure of the day.
- 开场最重要的是要有耐心。 5 分钟图表上有 81 个柱线,通过等待 6 个柱线,交易者将更清楚地了解当天可能的结构。
Yesterday’s Emini setups